English Living
Britain, Scotland, Wales & Northern Ireland
Homes, Interiors & More
UK News
England’s top local areas for E-Waste collection revealed

DTP Group
The UK currently ranks as the world's second-largest contributor of e-waste per capita (24kg per person) and is projected to surpass current leader Norway in the coming years. DTP Group shares comprehensive research on
E-Waste statistics with over 50 current statistics to highlight this growing environmental challenge.
Intrigued by this, DTP Group wanted to see which area in England leads the country for E-Waste collection, with 91,639 tonnes collected between 2020 and 2024.
Through Freedom of Information requests submitted to local councils across England, we’ve analysed eWaste collection data from 16 counties over a five-year period. The findings reveal substantial regional variations in electronic waste management, with collection volumes ranging from over 90,000 tonnes to just over 15,000 tonnes.
Local Authority E-waste Collection Volumes

Some key findings from our research include:
-
Essex generates an average of 22,910 tonnes annually
-
50% more than second-placed Lancashire, which collected 11,826 tonnes
-
Global e-waste generation is on track to reach 82m tonnes by 2030, up from 62m tonnes in 2022.
-
81 countries have any level of legislation for e-waste management - around 42 per cent of the global total.
-
Large household appliances are responsible for around 167,000 tonnes of e-waste annually in the UK.
-
Europe has the highest average e-waste per capita of any continent (16.2kg) but also boasts the highest recycling figure (42.8 per cent).
-
Less than a quarter (22.3 per cent) of global e-waste mass was properly recycled in 2022, leaving $62b worth of recoverable natural resources unaccounted for.
Essex has been ranked as the top performer in England for electronic waste collection. Over the past four years, they collected 91,639 tonnes, averaging 23,000 tonnes a year. This places this county well ahead of other counties across the country and shows a strong commitment to responsible electronic waste management.
In second place comes Lancashire with 59,130 tonnes collected from 2020 to 2024, an average of nearly 12,000 tonnes a year. Nearly 50% of what first position Essex collects. Third place saw Surrey with 53,303 tonnes total and a steady 13,326 tonnes a year.
The FOI data shows the regional variations in E-Waste collection across the country, highlighting the challenge of electronic waste management, with the top five areas alone gathering nearly 300,000 tonnes of E-Waste in just over four years.
The research highlights actionable insights on reducing e-waste, including purchasing refurbished devices, making recycling accessible, and supporting buy-back schemes. With over three-quarters (77.7 per cent) of global e-waste not formally recycled in 2022, these approaches could significantly impact this growing environmental challenge.
TOTAL UK HOUSEHOLD E-WASTE BY CATEGORY IN 2024
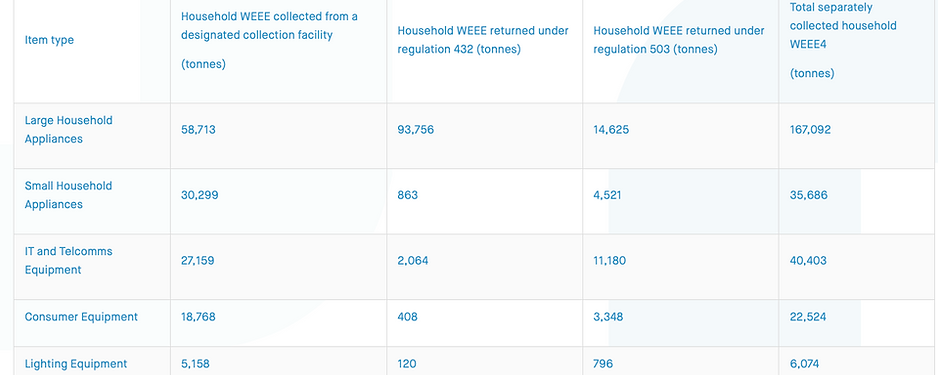
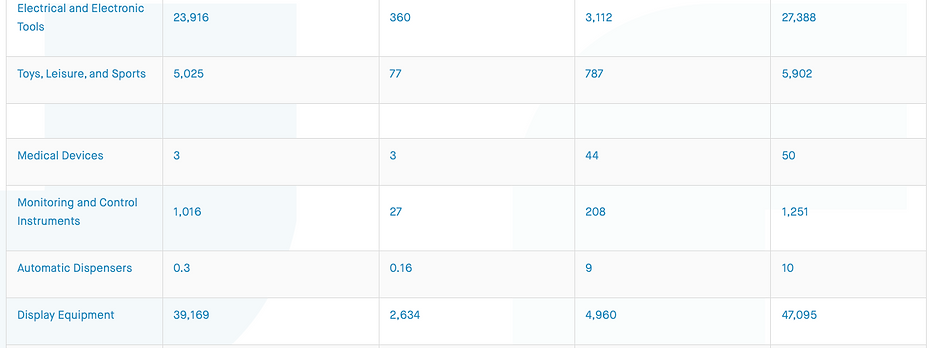
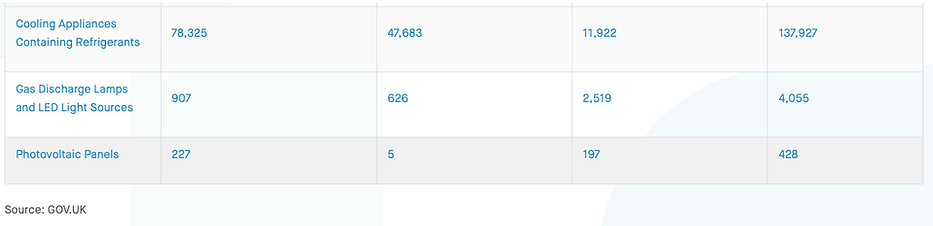
Large household appliances make up the most significant portion of collected household e-waste in the UK. With over 167,0000 tonnes collected in 2024, large household appliances were responsible for roughly a third (33.6%) of all collected e-waste.

By 2029, market value is expected to exceed $66.33 billion, marking a rise of over a third (+37%) from 2024. If correct, then the industry will experience a compound annual growth rate (CAGR) of 6.5% between 2024 and 2029.
HOW MUCH E-WASTE IS PRODUCED WORLDWIDE?
Recent e-waste statistics show a consistent rise in e-waste production since 2014, when the total stood at just over 44 million metric tonnes (Mt). A 4.5% rise in 2015 took the total to 46.4 Mt, before reaching 50 Mt for the first time two years later.

By 2022, the global volume of e-Waste stood at 62 Mt, marking a jump of around 8% in just one year. This means that global e-waste in 2022 was around two-fifths more than the total in 2014.
The acceleration in e-Waste looks set to continue in future years, surpassing 65 Mt in 2025 before soaring to 82 Mt in 2030. If correct, then global e-waste will climb by nearly a third (+32.2%) between 2022 and 2030.
WHICH CONTINENT PRODUCES THE MOST E-WASTE?
Asia is responsible for the most e-waste of any continent, with its total of 24.9 Mt, nearly double the total of the Americas in second place (13.1 Mt). However, Asia’s average waste per capita of 5.6kg was the second lowest of any continent and less than half the total of the Americas.

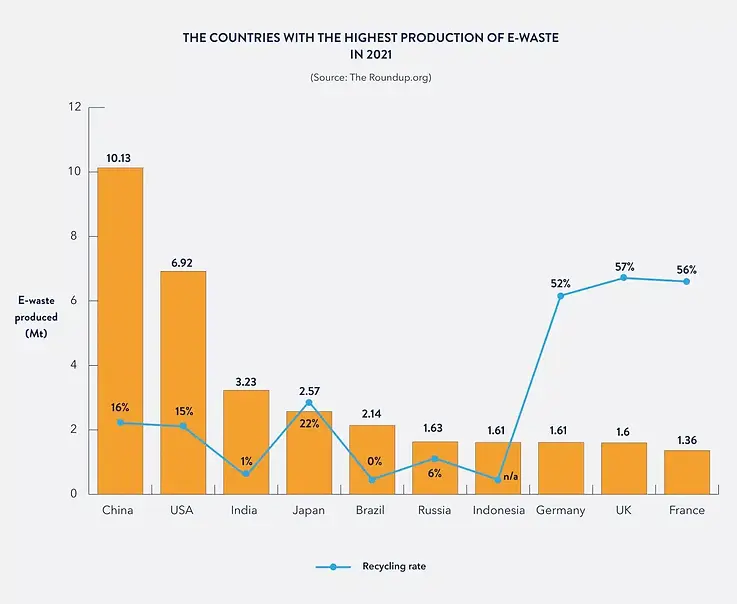
WHICH COUNTRY PRODUCES THE MOST E-WASTE?
E-waste statistics from Statista found that China is the biggest producer of e-waste globally, with waste totalling 12 Mt in 2022. This was over 70% more than the US in second place, which produced around 7 Mt that year.
HOW TO REDUCE EWASTE
While a global consensus is needed to tackle the growing e-waste crisis, there are steps you can take in your day-to-day life to ensure you’re contributing to the solution. We’ll cover a few of these below:
BUY REFURBISHED DEVICES
Buying refurbished items can help reduce your personal e-waste footprint while saving you money along the way. Refurbished electronics are typically pre-owned items that have been repaired, restored, and tested to ensure they’re in full working order.
Common refurbished items that people buy include:
-
Smartphones
-
Laptops
-
Tablets
-
Games Consoles
-
Cameras
-
Sound equipment (e.g. speakers, headphones, stereos)
-
Large household appliances (e.g. refrigerators, washing machines, dishwashers)
-
Small household appliances (e.g. microwaves, vacuum cleaners)